status
Learn about status service.
/status shows primary statistics of services inside the server. The data sources are same with /vars, but stats are grouped differently.
Meanings of the fields above:
- non_service_error: number of errors raised outside processing code of the service. When a valid service is obtained, the subsequent error is regarded as service_error, otherwise it is regarded as non_service_error (such as request parsing failed, service name does not exist, request concurrency exceeding limit, etc.). As a contrast, failing to access back-end servers during the processing is an error of the service, not a non_service_error. Even if the response written out successfully stands for failure, the error is counted into the service rather than non_service_error.
- connection_count: number of connections to the server from clients, not including number of outward connections which are displayed at /vars/rpc_channel_connection_count.
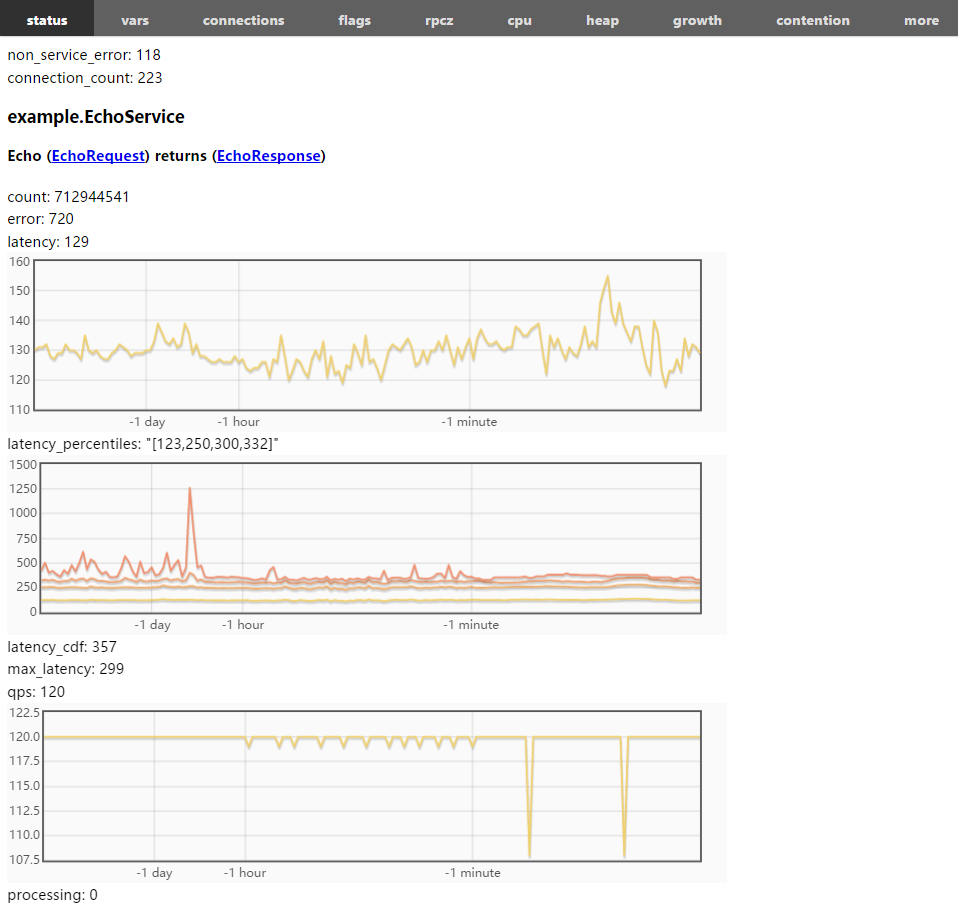
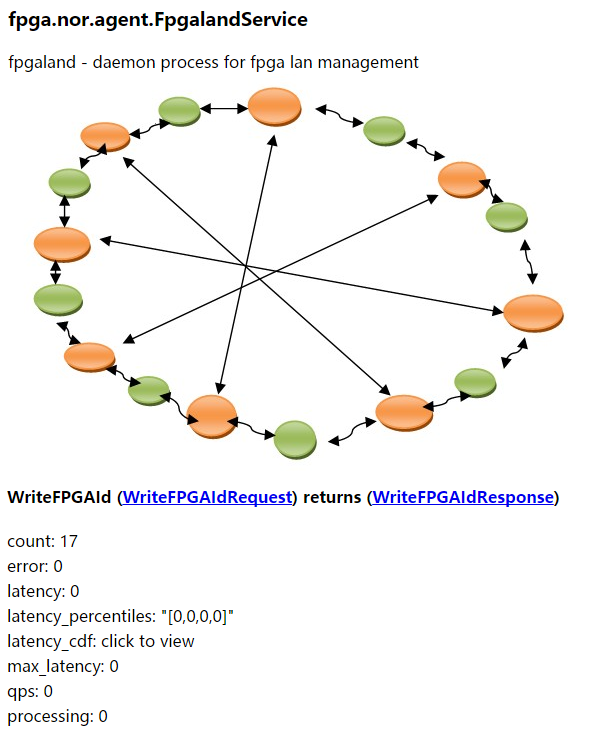
- example.EchoService: Full name of the service, including the package name defined in proto.
- Echo (EchoRequest) returns (EchoResponse): Signature of the method. A service can have multiple methods. Click links on request/response to see schemes of the protobuf messages.
- count: Number of requests that are succesfully processed.
- error: Number of requests that are failed to process.
- latency: average latency in recent 60s/60m/24h/30d from right to left on html, average latency in recent 10s(by default, specified by -bvar_dump_interval) on plain texts.
- latency_percentiles: 80%, 90%, 99%, 99.9% percentiles of latency in 10 seconds(specified by-bvar_dump_interval). Curves with historical values are shown on html.
- latency_cdf: shows percentiles as CDF, only available on html.
- max_latency: max latency in recent 60s/60m/24h/30d from right to left on html, max latency in recent 10s(by default, specified by -bvar_dump_interval) on plain texts.
- qps: QPS(Queries Per Second) in recent 60s/60m/24h/30d from right to left on html. QPS in recent 10s(by default, specified by -bvar_dump_interval) on plain texts.
- processing: (renamed to concurrency in master) Number of requests being processed by the method. If this counter can’t hit zero when the traffic to the service becomes zero, the server probably has bugs, such as forgetting to call done->Run() or stuck on some processing steps.
Users may customize descriptions on /status by letting the service implement brpc::Describable.
class MyService : public XXXService, public brpc::Describable {
public:
    ...
    void Describe(std::ostream& os, const brpc::DescribeOptions& options) const {
        os << "my_status: blahblah";
    }
};
For example:
Last modified February 26, 2022: brpc website 1.0 fix links jump problem in overview page (14eec1ac1)